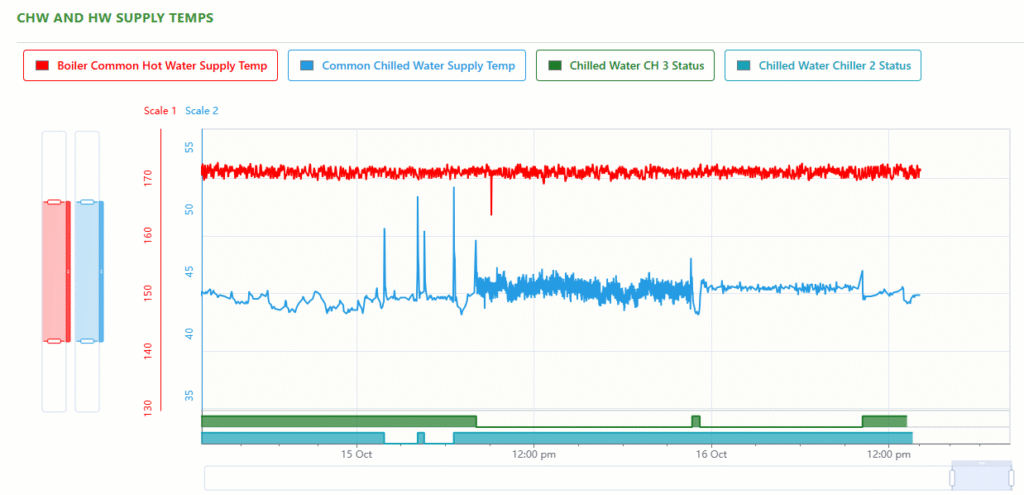
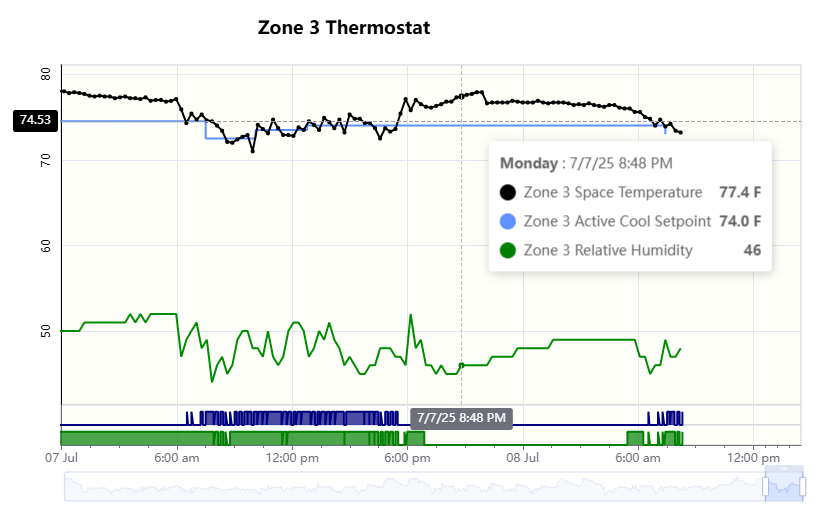
Interactive Charts Trend Charts provide an excellent way to analyze system performance over time.You can create and save Charts to display historic values from any combination the Points in your site. Built-in Trending Interactive trend graphs for performance analysis. Interactive trend graphs that are User-Configurable. Pan and Zoom controls allow you to focus on important events. All data is automatically saved in our secure, redundant databases. You can keep it private, or share it with those you authorize. All of your archived data is readily available for download. Standard csv format makes data compatible with many other applications.